
Код товара: 4228979853
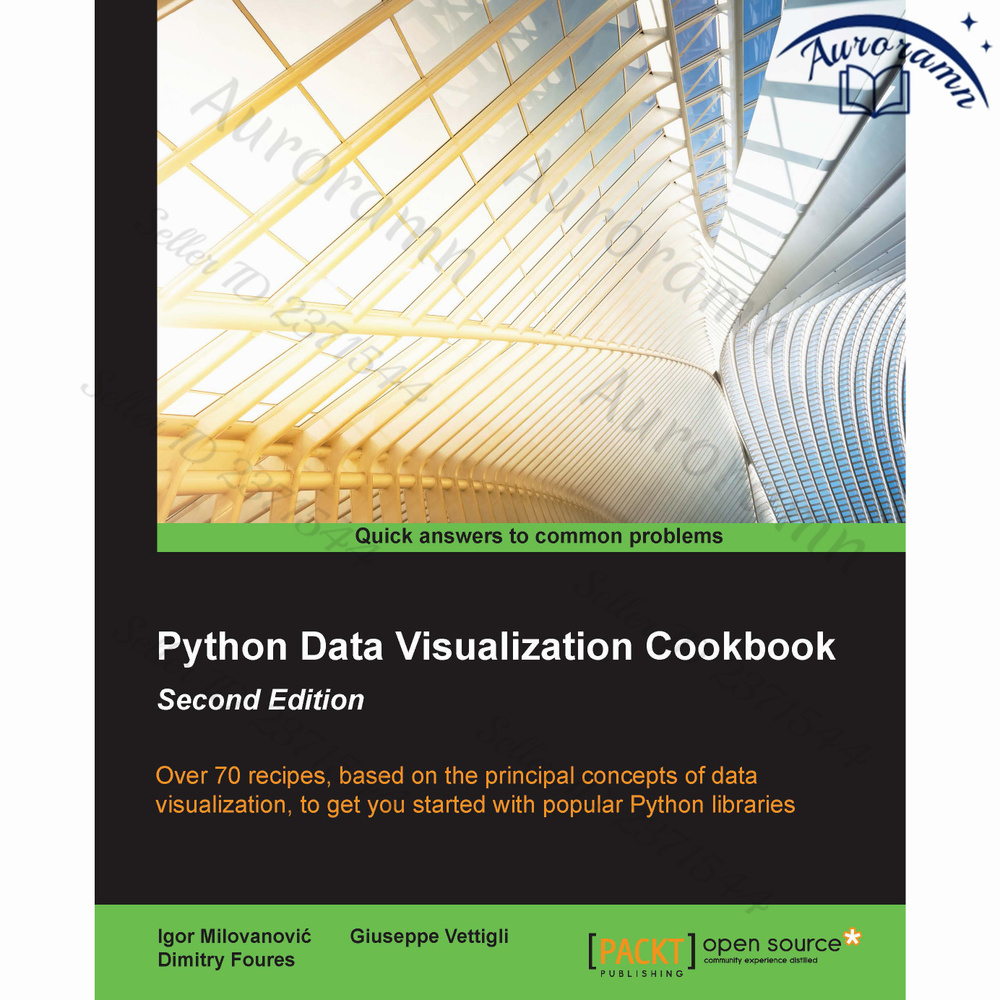
Python Data Visualization Cookbook (Second Edition): Visualize data using Python's most popular libraries
Тип книги:
Печатная книга
О товаре
Перейти к описанию
Автор на обложке
0
Год выпуска
2015
Тип бумаги в книге
Мелованная матовая
Тип обложки
Мягкая обложка
Тип книги
Печатная книга
О книге
Введение в книгу : Key benefits
Learn how to set up an optimal Python environment for data visualization
Understand how to import, clean and organize your data
Determine different approaches to data v
Товар не доставляется в ваш город
Доставка недоступна
Магазин
Подписаться
Auroramn Library
Перейти
4.7
Чат
О магазине
Часто задаваемые вопросы
Описание
Введение в книгу : Key benefits
Learn how to set up an optimal Python environment for data visualization
Understand how to import, clean and organize your data
Determine different approaches to data visualization and how to choose the most appropriate for your needs
Description
Python Data Visualization Cookbook will progress the reader from the point of installing and setting up a Python environment for data manipulation and visualization all the way to 3D animations using Python libraries. Readers will benefit from over 60 precise and reproducible recipes that will guide the reader towards a better understanding of data concepts and the building blocks for subsequent and sometimes more advanced concepts. Python Data Visualization Cookbook starts by showing how to set up matplotlib and the related libraries that are required for most parts of the book, before moving on to discuss some of the lesser-used diagrams and charts such as Gantt Charts or Sankey diagrams. Initially it uses simple plots and charts to more advanced ones, to make it easy to understand for readers. As the readers will go through the book, they will get to know about the 3D diagrams and animations. Maps are irreplaceable for displaying geo-spatial data, so this book will also show how to build them. In the last chapter, it includes explanation on how to incorporate matplotlib into different environments, such as a writing system, LaTeX, or how to create Gantt charts using Python.
#программирование
- Артикул
- 4228979853
- Автор на обложке
- 0
- Год выпуска
- 2015
- Тип бумаги в книге
- Мелованная матовая
- Тип обложки
- Мягкая обложка
- Тип книги
- Печатная книга
- Язык издания
- Английский
- Количество страниц
- 302
- Размеры, мм
- 251*179*25
- Вес товара, г
- 588
- ISBN
- 9781784394943
Подборки товаров в категории Научная и научно-популярная литература
Отзывы о товаре
0
Python Data Visualization Cookbook (Second Edition): Visualize data using Python's most popular libraries
Рейтинга пока нет. Он формируется на основе актуальных отзывов на заказанные и оплаченные товары
Как правильно задавать вопросы?
Будьте вежливы и спрашивайте о товаре, на карточке которого вы находитесь
Если вы обнаружили ошибку в описанием товара, воспользуйтесь функцией
Как отвечать на вопросы?
Отвечать на вопросы могут клиенты, купившие товар, и официальные представители.
Выбрать «Лучший ответ» может только автор вопроса, если именно этот ответ ему помог.